An Analysis of Polity IV and its Components
The Polity IV data-set is very widely (mis)used in political science, and probably will continue to be for some time. It includes measures the "authority characteristics" of states. The most used measures in these data are the autocracy scale, the democracy scale, and a combination thereof.
Famous (in my mind anyhow) misuses of the data include using it to predict instability (which it measures) or using it to predict state repression (which it also measures, as pointed out here and here). There are probably tons of other misuses out there that I am unaware of (though I'd be entertained if you sent me some). Note that these problems are not necessarily problems with the data, but problems with the manner in which they are employed.
Of course, there are problems with the data, some conceptual, some methodological. First, "democracy" is a laundry list of all the good properties that a government might have. Lack of repression, universal franchise, etc. This makes the variable somewhat less theoretically relevant (though, to be fair, many "theories" in social science make claims about "democracy," without reference to a specific characteristic a regime might have) and also complicates measurement. Assuming we have a clear conceptual definition of democracy (not just "all the good stuff") we can go about measuring the concept, which is what the Polity project has done (albeit with the garbage-can definition of democracy).
The democracy and autocracy scores in Polity IV are made up of components which are scored and weighted by hand. Implicitly, Polity is taking the multidimensional concept of democracy and reducing it to a uni-dimensional scale (so by definition there is a loss of information). However it is not at all clear that a uni-dimensional scale is appropriate. There have been several attempts to investigate the validity of these measures or to improve upon them, notably Trier and Jackman (2008), Ward and Gleditsch (1997), and Pennstein, Meserve, and Melton (2010).1 Although all of these articles are interesting in their own right, the eldest of the three is due for an update.
Ward and Gleditsch used decision trees to estimate the importance of different components of the democracy, autocracy, and combined scores that are commonly used in applied political science research. The key reason why this is important is because there are a very large number of ways that a particular country could receive a particular score. Despite this, there appear to be relatively few combinations that are actually observed. Decision trees, being a form of localized regression, model non-linear partial effects as well as interactions and so would be a good way to see which "paths" are commonly taken to get to particular scores (thereby also letting us investigate which components are most important in determining the score on each scale). Since their article was published better methods for answering this question have become available and the Polity data have been updated.
Their analysis used the Polity III scale (the most current at the time). The Polity III scale was a combination of the competitiveness of political participation (parcomp), regulation of political participation (parreg), the competitiveness of executive recruitment (xrcomp), the openness of executive recruitment (xropen), and constraints on the chief executive (xconst). Each of these components are themselves made up of a number of different measurements. The democracy scale lacks the regulation of participation component (parreg).
Gleditsch and Ward find that executive constraint (xconst) is the most important component of the democracy score, followed by the competitiveness of executive recruitment and the competitiveness of participation. For the autocracy scores, on the contrary, they find that executive recruitment is the most important. For the combined democracy-autocracy score, they find that executive constraint is again the most important.2
As I mentioned, there are some methodological issues with their paper (some perhaps unavoidable at the time). It is well known that most implementations of decision trees (and ensembles of them as well) are a biased method of variable selection. Specifically, variables with more splits tend to be selected more often. Since they are (it seems anyhow, this part is a bit unclear) using the number of splits made on a variable as their measure of importance, this importance measure is biased as well. This would bias the importance measures in favor of participation competitiveness (parcomp) and executive constraint (xrconst), since they have the widest range of all the components. Decision trees also tend to over-fit (unsurprising given that this is localized regression without a penalty), hence the focus on stopping criteria and pruning in the literature. A decision tree is also a high variance estimator, i.e., if you pass it a slightly different sample of observations and variables, you may get very different results. This is why random forests (an ensemble of decision trees) are often used. Instead of getting the class label of an observation from a single tree, you get a consensus vote from a large number of trees.
A random forest of conditional inference trees allows for unbiased variable selection. This method is, like all decision trees, a recursive partitioning algorithm, albeit with a more "statistical" approach. This algorithm separates the variable selection and splitting steps and uses a local stopping criteria (are we able to reject the null hypothesis of no relationship with one of the variables available for selection at this node at a pre-specified level of confidence). A pretty good description of the algorithm can be found in the party package's vignette and one of the more recent papers on the topic, Hothorn, Hornick, and Zeileis (2006).
Rather than using the number of times a variable is selected for a split as my measure of variable importance, I use permutation importance. After fitting the random forest, each covariate is permuted randomly. If the variable being permuted is important, the mean classification performance across all trees should decrease. If not, the changes in performance should be random. This does, of course, leave open the possibility that unimportant variables correlated with important variables could be deemed important despite their true lack of importance. The test describes marginal variable importance, not partial variable importance, since it is conditional only on previous splits in the tree. The marginal permutation importance measure is testing the null hypothesis that $P(Y, X_j, Z) = P(Y, Z)P(X_j)$, where $Y$ is the dependent variable, $X_j$ is the variable being permuted, and $Z$ is the set of all remaining predictor variables. One way to avoid this (partially anyhow) is to do conditional permutation tests, i.e., instead of testing the hypothesis that the variable being permuted is unrelated to the dependent variable and the other variables in the tree, test whether the permuted variable is unrelated to the dependent variable conditional on a partition of the rest of the feature space. The conditional permutation tests the null hypothesis that $P(Y, X_j|Z) = P(Y|Z)P(X_j|Z)$. This is very computationally expensive. Strobl, Boulesteix, Kneib, Augustin, and Zeileis (2008) have an article on the topic if you are interested in reading more. The variable importance measures below all reflect conditional permutation importance.
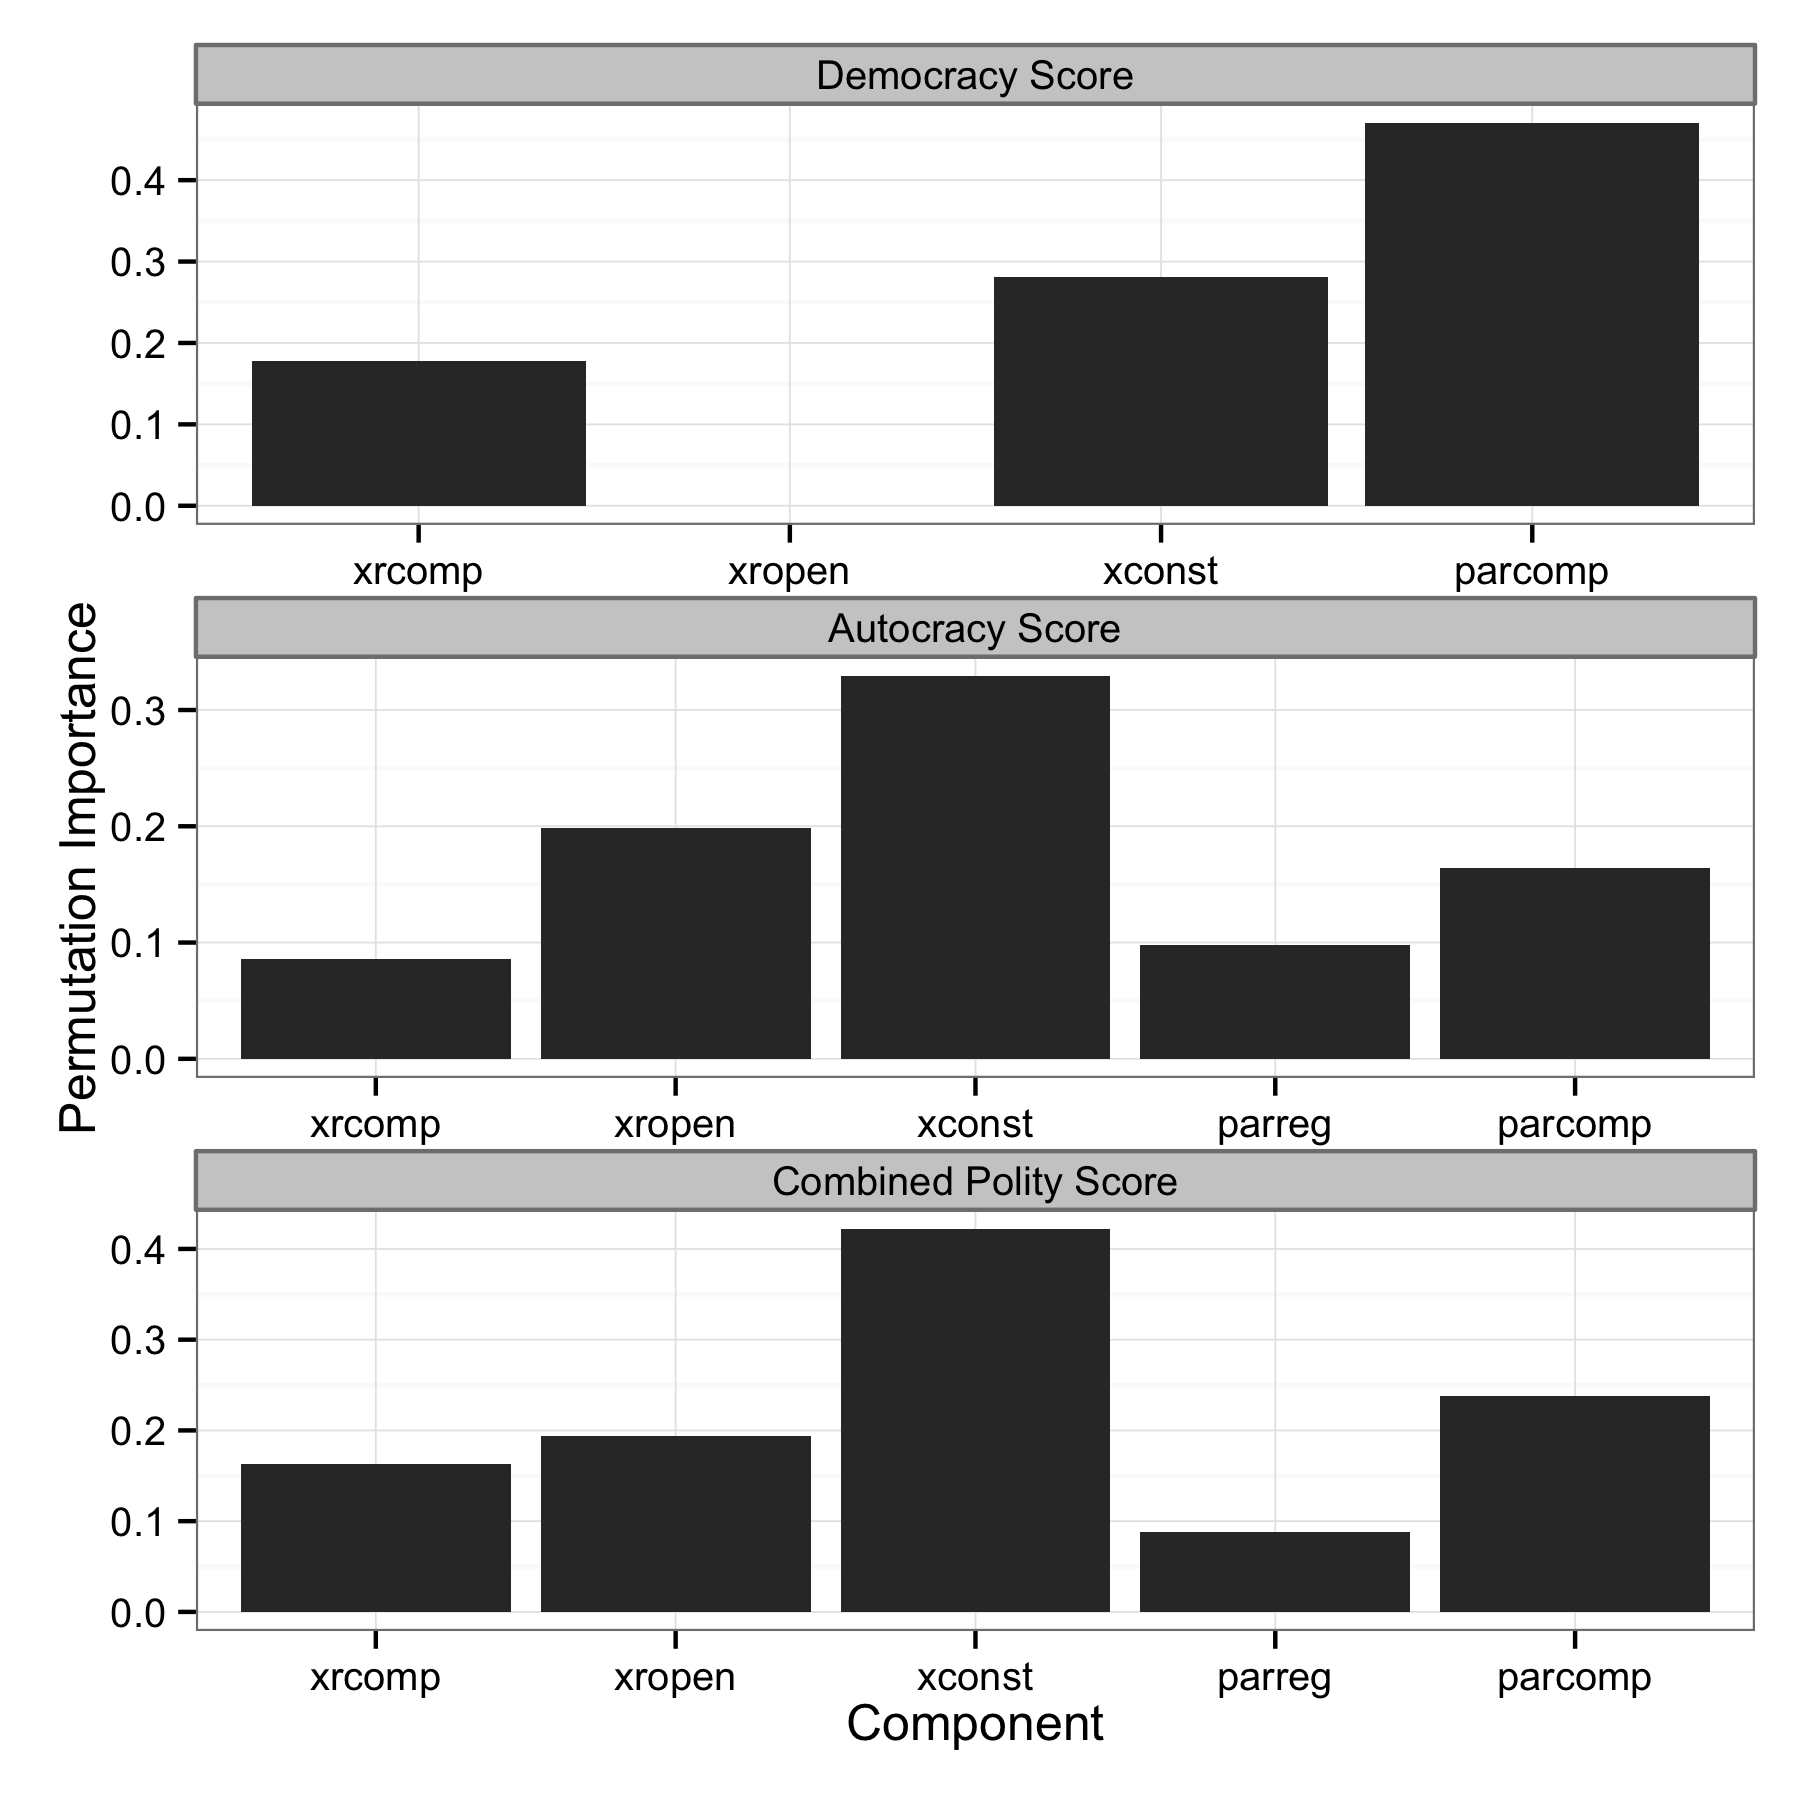
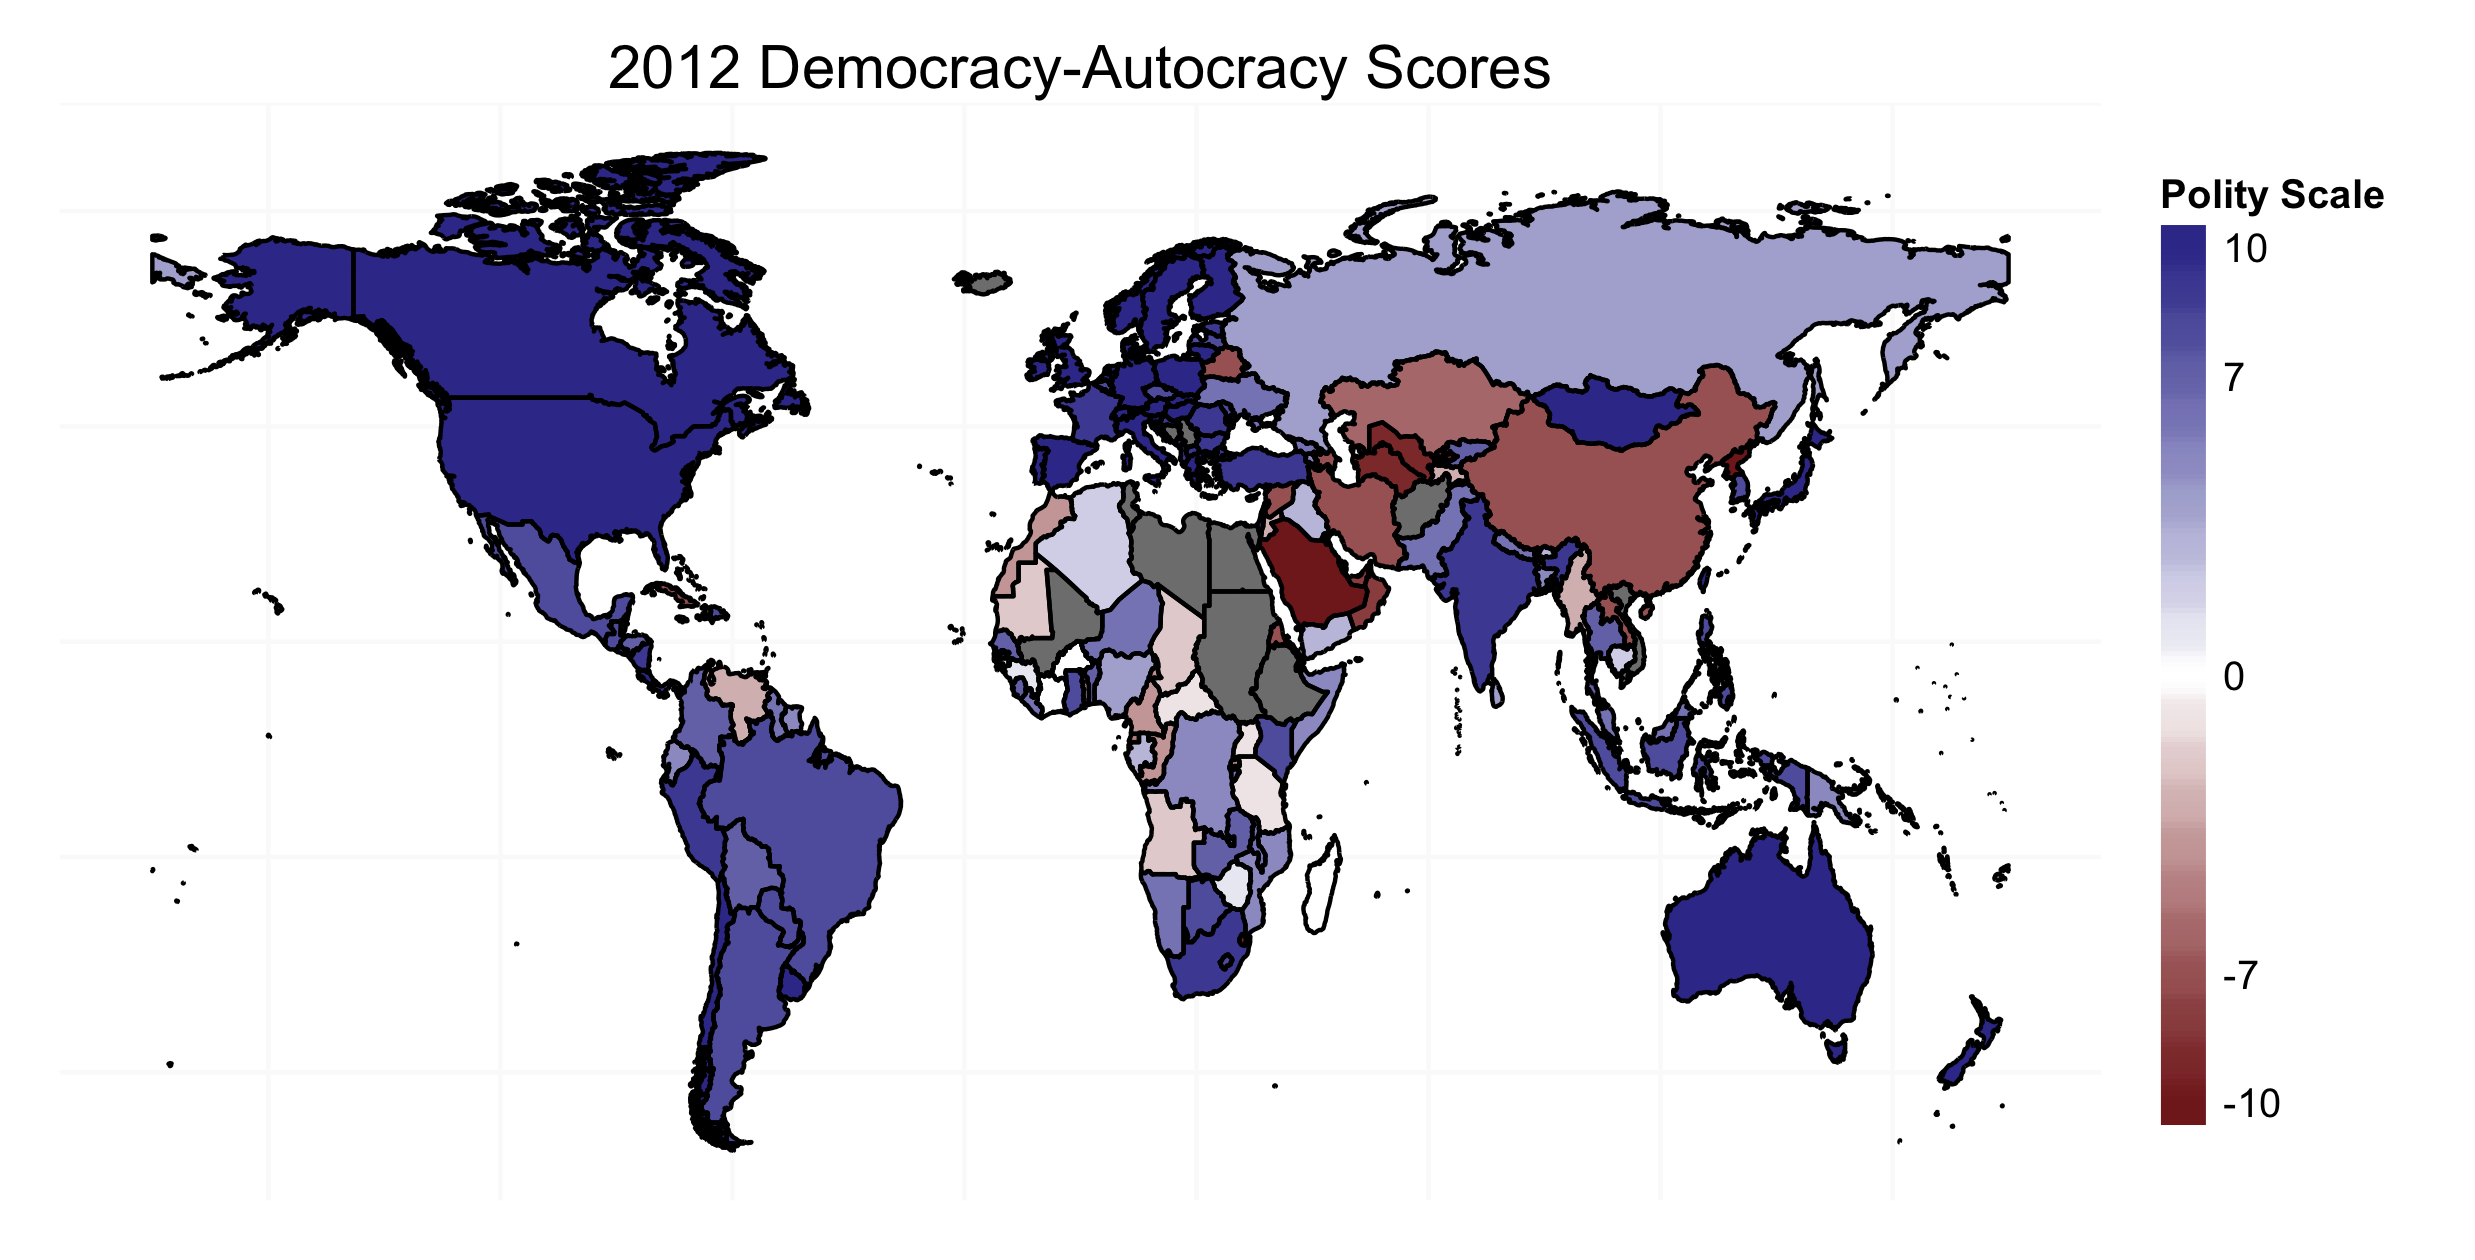
This shows the conditional permutation importance for the Polity IV democracy, autocracy and democracy minus autocracy scales. The gray bars at the top of each panel show which scale is being used as the dependent variable, and the $x$-axis shows the importance of each component.
It seems that Gleditsch and Ward's finding (that executive constraint is the most important component of all of the components) holds up to some degree. It is clear, however, that executive constraint does not "virtually determine" scores on any of the three scales, as argued by Gleditsch and Ward. Participation competitiveness is much more important in determining democracy scores relative to executive constraint. Autocracy scores and the aggregated scale both show executive constraint to be the most important variable, but the other components also have non-zero importance. That so much empirical work that theoretically discusses "democracy," but is in fact measuring something akin to a (or a few) component(s) of democracy (depending on what scale you are using) should be a major issue in all relevant literature.
If you want to download the R script you can do so here. The data (just a csv version of the Excel file on the Polity IV homepage) is available here.
set.seed(1987)

pkgs <- c("multicore", "party", "reshape2", "ggplot2", "cshapes", "rgeos")
invisible(lapply(pkgs, require, character.only = TRUE))

df <- read.csv("http://zmjones.com/static/data/polity.csv",
               na.strings = c("-88", "-77", "-66"))
df <- df[!is.na(df$polity2) & !is.na(df$democ) &
         !is.na(df$autoc), c(2,5,8:9,11,14:18)]

world <- cshp(date = as.Date("2008-1-1"))
world.pts <- fortify(world, region = "COWCODE")
names(world.pts)[7] <- "ccode"
df.latest <- df[df$year == max(df$year), ]
polity.map <- merge(world.pts, df.latest, sort = FALSE,
                    by = "ccode", all.x = TRUE)
polity.map <- polity.map[order(polity.map$order), ]

map.theme <- function() {
    theme_bw() + theme(axis.line = element_blank(),
                       axis.text.x = element_blank(),
                       axis.text.y = element_blank(),
                       axis.title.x = element_blank(),
                       axis.title.y = element_blank(),
                       axis.ticks = element_blank(),
                       panel.border = element_blank(),
                       panel.grid.major = element_blank(),
                       plot.margin = unit(c(.1, .1, .1, .1), "in"))
}

p <- ggplot(data = polity.map, aes(x = long, y = lat,
                group = group, fill = polity2))
p <- p + geom_polygon()
p <- p + geom_path()
p <- p + scale_y_continuous(breaks = (-2:2) * 30)
p <- p + scale_x_continuous(breaks = (-4:4) * 45)
p <- p + scale_fill_gradient2(name = "Polity Scale",
                              breaks = c(-10, -7, 0, 7, 10))
p <- p + labs(title = "2012 Democracy-Autocracy Scores", x = NULL, y = NULL)
p <- p + guides(fill = guide_colorbar(barwidth = .75,
                    barheight = 15, ticks = FALSE))
p <- p + map.theme()
ggsave("polity_map.png", plot = p, height = 4.2, width = 8.25)

df <- lapply(df[, -c(1:2)], switch("ordered", ordered = as.ordered))
df <- as.data.frame(df)

ivars <- vector("list", length = 3)
ivars[["democ"]] <- names(df[, -c(1:3,7)])
ivars[["autoc"]] <- names(df[, -c(1:3)])
ivars[["polity2"]] <- names(df[, -c(1:3)])

imp <- mclapply(names(df[, c(1:3)]), function(x) {
    formula <- as.formula(paste0(x, "~", paste0(ivars[[x]], collapse = "+")))
    varimp(cforest(formula, data = df), conditional = TRUE)
}, mc.cores = 8)

insert <- function(v, e, pos, name) {
    v <- c(v[1:(pos - 1)], e, v[pos:(length(v))])
    names(v)[pos] <- name
    return(v)
}

imp[[1]] <- insert(imp[[1]], NA, 4, "parreg")
imp <- as.data.frame(do.call("rbind", imp))
imp$depvar <- c("Democracy Score", "Autocracy Score", "Combined Polity Score")
imp$depvar <- factor(imp$depvar, levels = imp$depvar)
imp <- melt(imp, id.vars = "depvar")

p <- ggplot(data = na.omit(imp), aes(x = factor(variable), y = value))
p <- p + facet_wrap(~ depvar, ncol = 1, scales = "free")
p <- p + geom_bar(stat = "identity")
p <- p + labs(x = "Component", y = "Importance",
              title = "Polity Component Importance")
p <- p + theme_bw()
p + theme(plot.margin = unit(rep(.15, 4), "in"))
-
Somewhat confusingly they say (in the conclusion): "Although the degree of executive constraints accounts for only 4 of the possible 10 democracy scale points, all of our analyses point strongly to the conclusion that this variable virtually determines the democracy and autocracy scale values." So, it is not entirely clear how they are measuring variable importance. ↩