Redux of An Empirical Evaluation of Explanations for State Repression
This is an extension of my recent paper "An Empirical Evaluation of Explanations for State Repression" with Daniel W. Hill Jr.. The figures from analysis of the original variables are here and the extended version here.
Here we present the results of a supplementary analysis with several additional variables. These are variables that represent theorized causes of state repression and which we neglected to include in our original analysis. The additional variables include two additional measures of judicial independence: the ICRG "law and order" index, 1 and the contract intensive money indicator developed by (Clague, Keefer, Knack, and Olson 1999), four different measures of the imposition of economic sanctions from Wood 2008 and Peksen 2009, the contract intensive economy measure created by Mosseau and Mosseau 2008, and a measure of territorial revisionism in a militarized dispute (MID) from Wright 2014.
The ICRG variable is created from subjective assessments of both the quality of the judiciary and the degree to which citizens generally follow the law. The CIM variable captures the ratio of non-currency money to the total money supply, and is used as an indicator of confidence in the government's willingness and ability to enforce property rights. It is also sometimes used as a measure of judicial independence (See e.g., Powell and Staton 2009 and Rios and Staton 2014). Two of the sanctions variables come from Wood 2008. One of these measures the imposition of unilateral sanctions by the US, and another measures the imposition of multilateral sanctions by the UN. The remaining two sanctions measures come from Peksen 2009 and distinguish between sanctions imposed with the explicit goal of preventing human rights abuse, and those imposed for reasons unrelated to human rights. All of the sanctions variables are ordinal, with higher values indicating more severe sanctions. The contract intensive economy variable measures (the natural log of) life insurance premiums per capita, and is a proxy for contract-based economic exchange. Territorial revisionism in a MID measures revisionist intentions on the part of a state involved in a military dispute, i.e. an intention to change the status-quo division of territory.
As the figures presented here show, many of these variables significantly improve predictive power. The law and order index did very well in the linear models using aggregate measures of repression. Using the dynamic latent variable from Fariss 2014, the law and order index adds more power than civil war. It is in the top 5 for all of the linear models (with or without civil war), and does very well for the logistic models using the CIRI components as well, especially those for disappearances and killing. It also does relatively well in the permutation test. A word of caution is in order, however, since this variable is based on subjective judgements and may reflect a perception that human rights (including those measured by our dependent variables) are generally protected by the legal system. Interestingly, the CIM variable we use as another alternative indicator of judicial independence adds no predictive power to any of the regression models, nor does it do very well in the permutation test.
New Results
Cross-Validation of Linear Regression
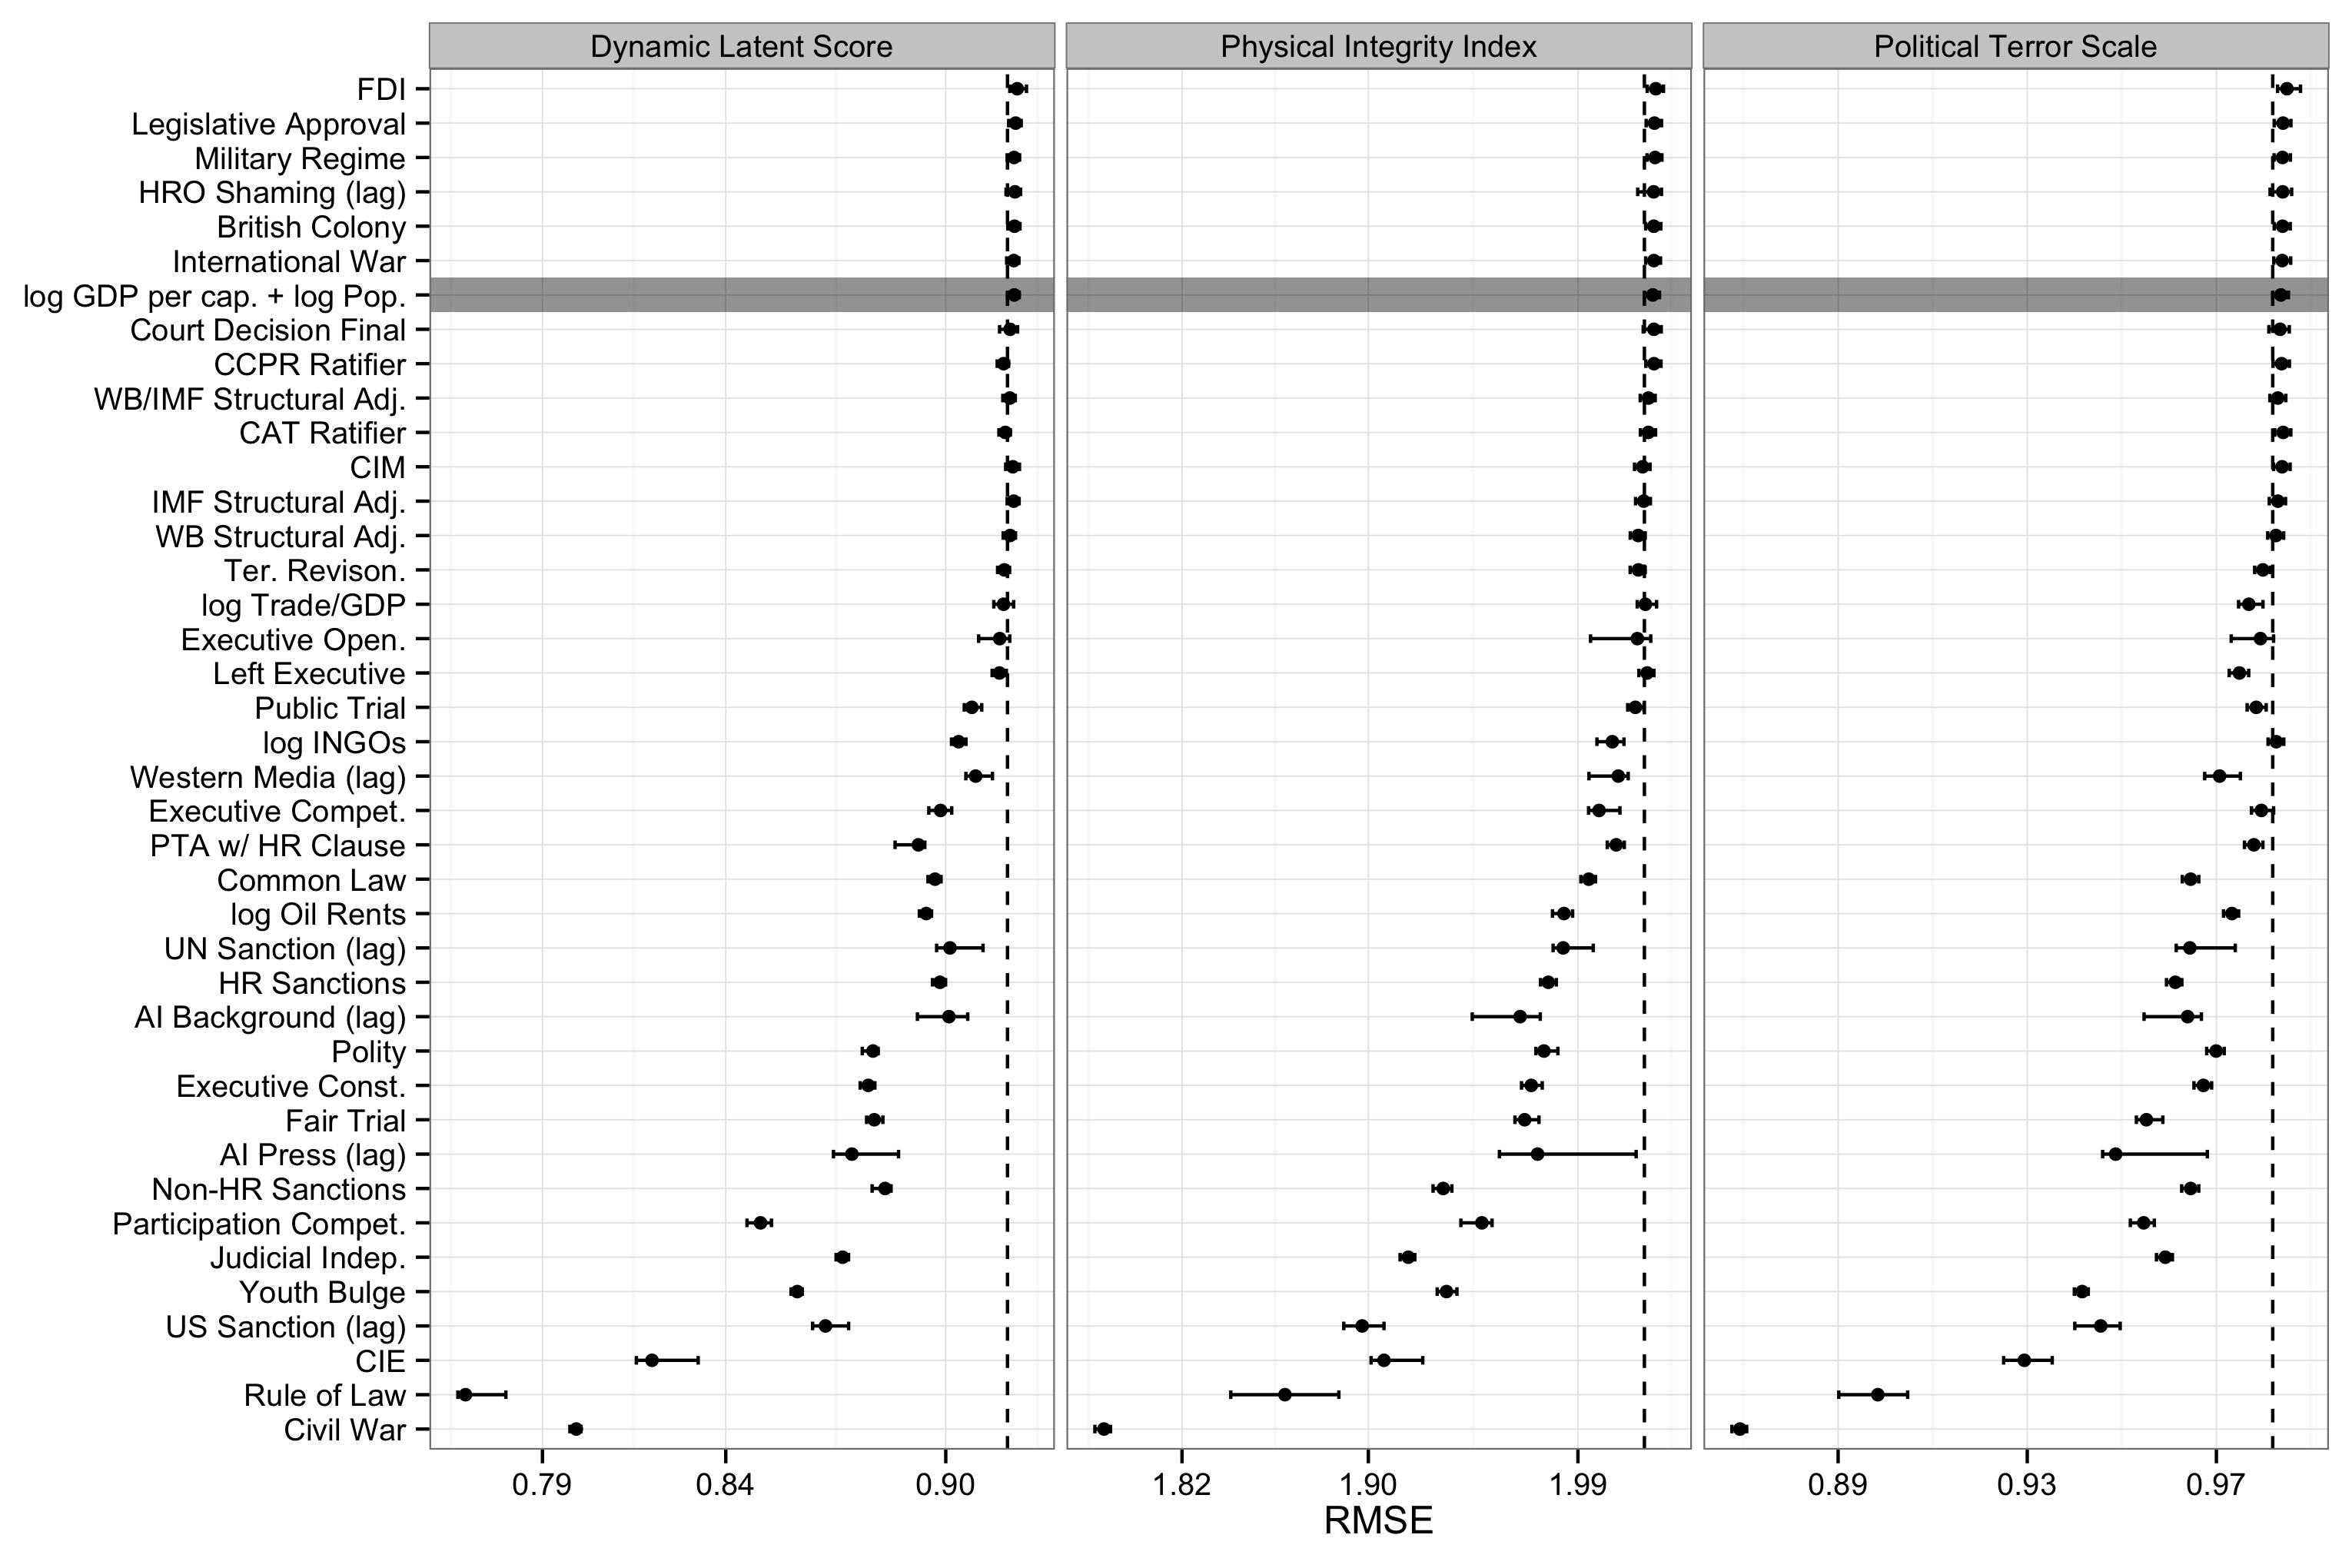
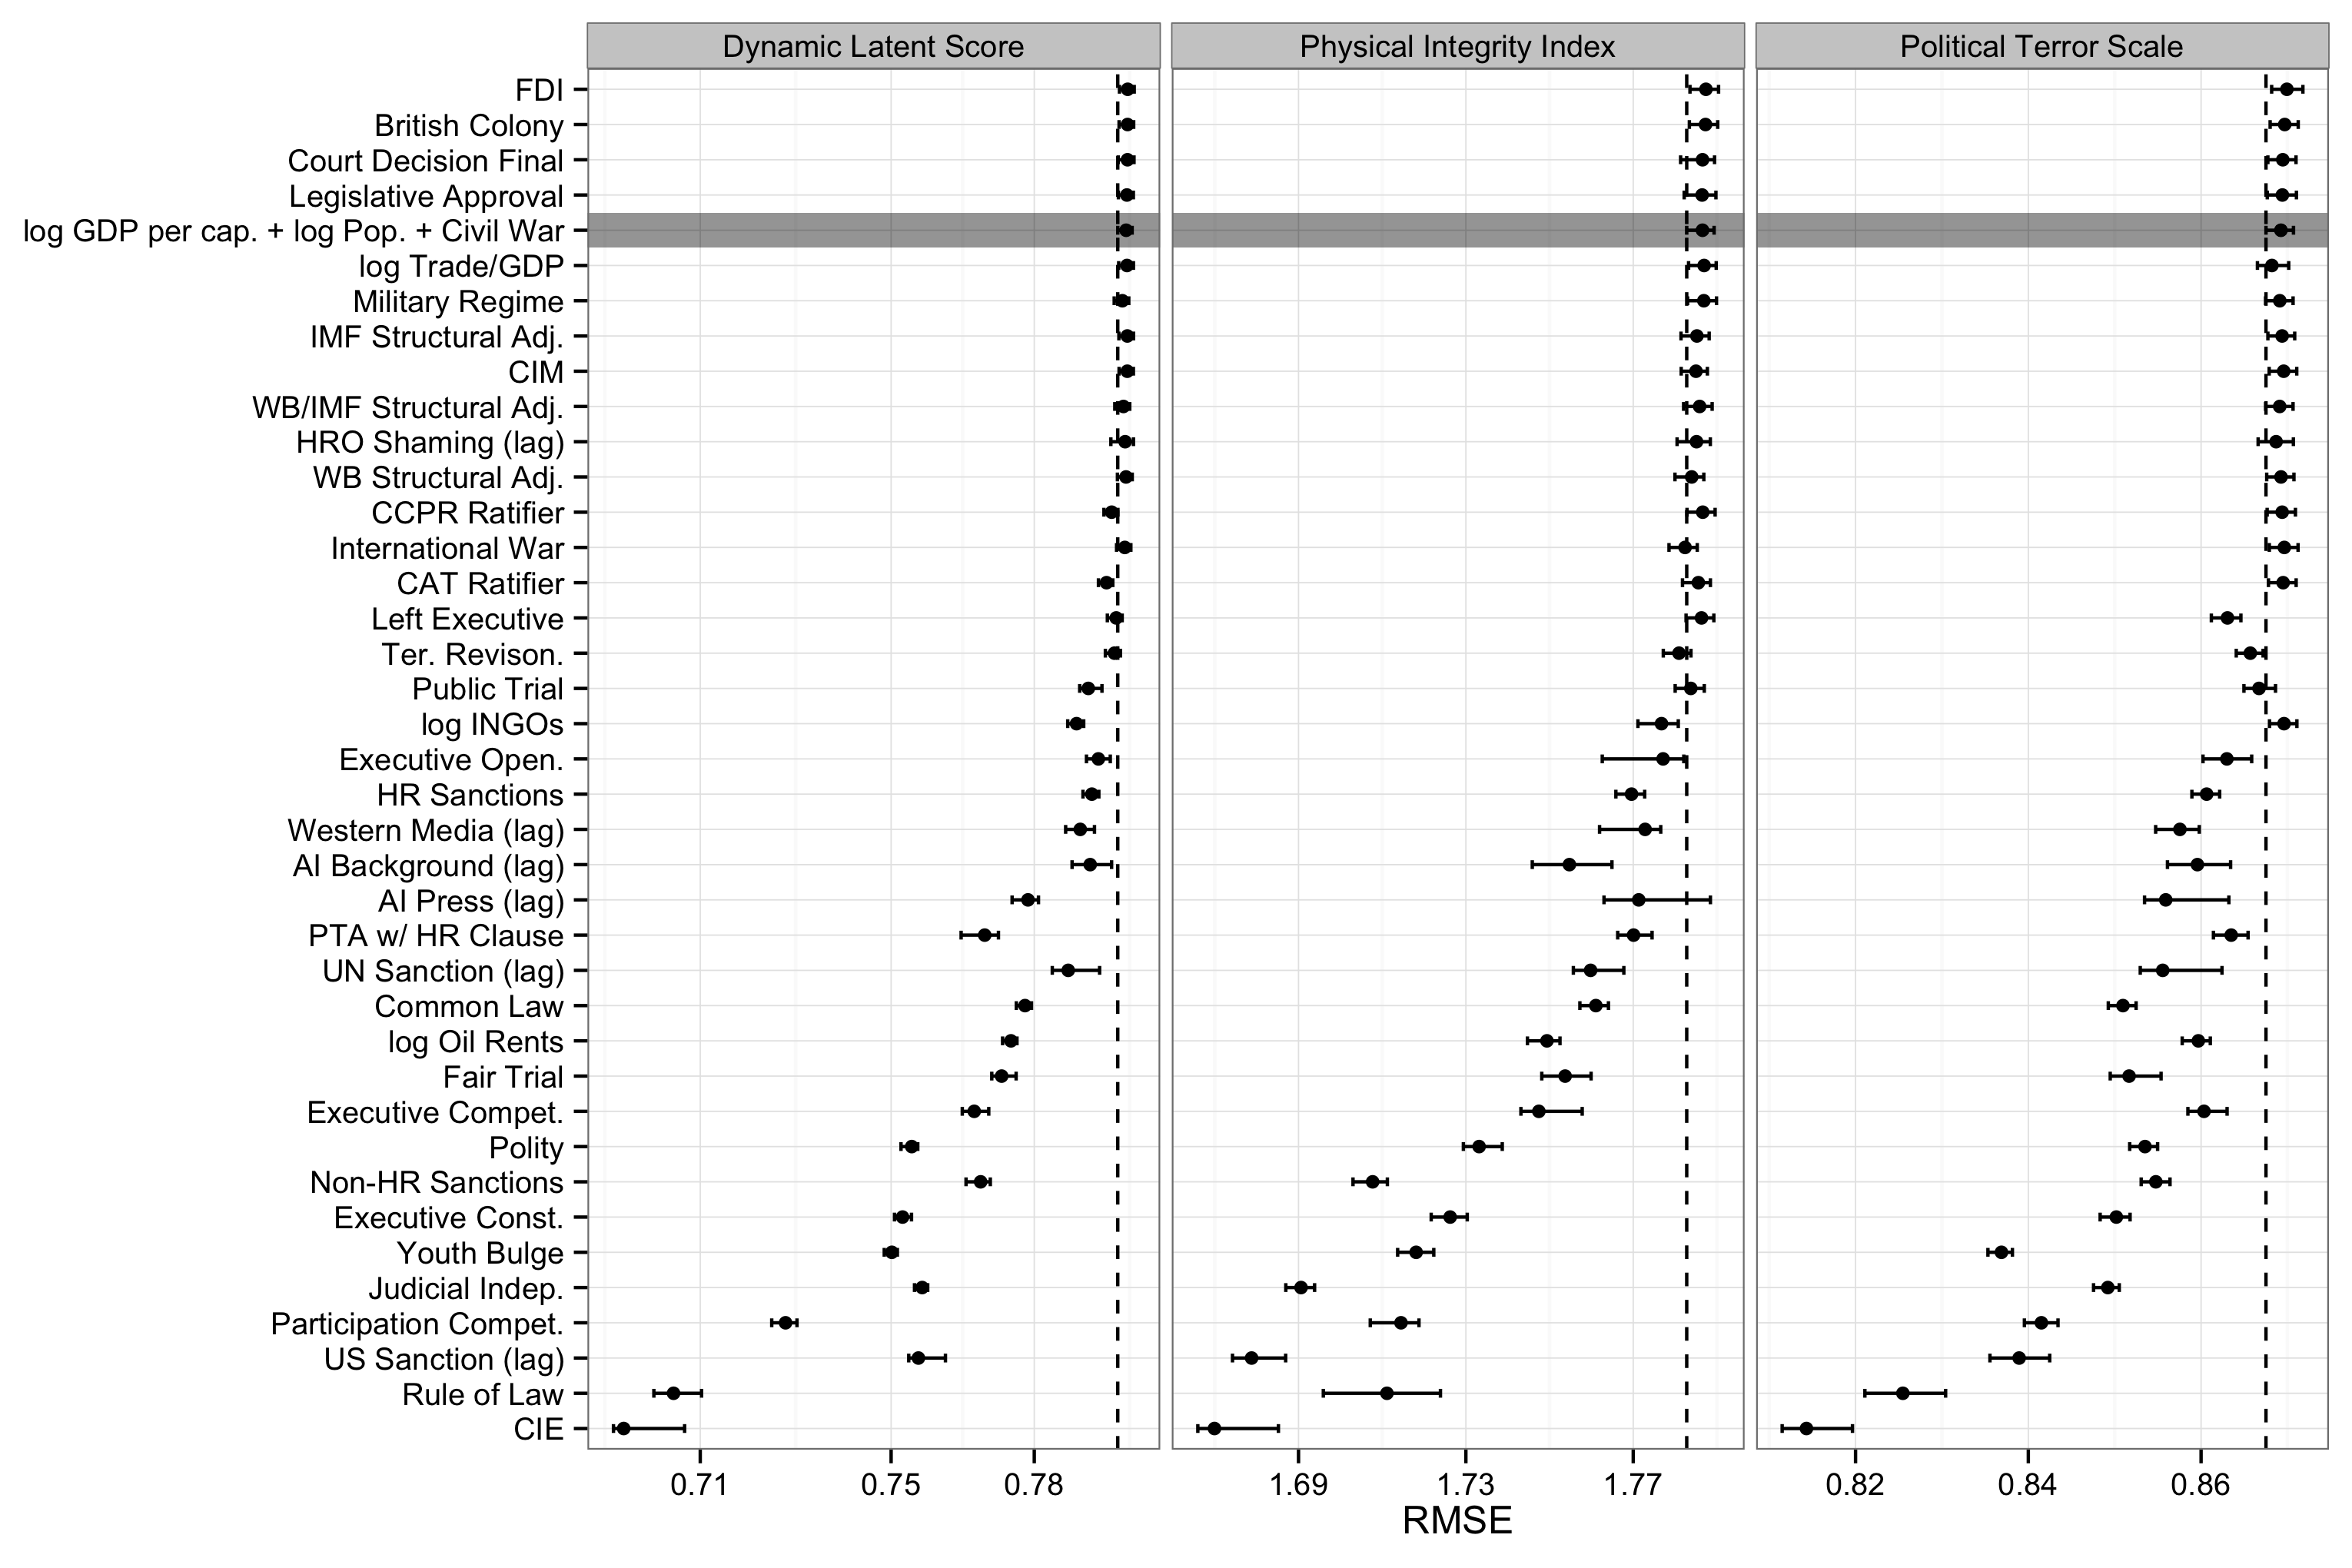
Results from 10-fold cross-validation with 1000 resampling iterations for linear (OLS) models of repression using (the natural logs of) GDP per capita and population (top figure) and (the natural of logs of) GDP per capita, population, and civil war (bottom figure). The $x$-axis shows root mean squared error (RMSE). The $y$-axis represents model specifications which are composed of a base model, which is indicated by the gray band, and the variable indicated on the $y$-axis. The dots show the median of the sampling distribution of the RMSE statistic, along with the $.025$ and $.975$ quantiles. The dotted line shows the $.025$ quantile of the sampling distribution of RMSE for the base model. Model specifications whose intervals overlap with this line do not add significantly to the fit of the model compared to the base specification.
Cross-Validation of Ordinal Logistic Regression
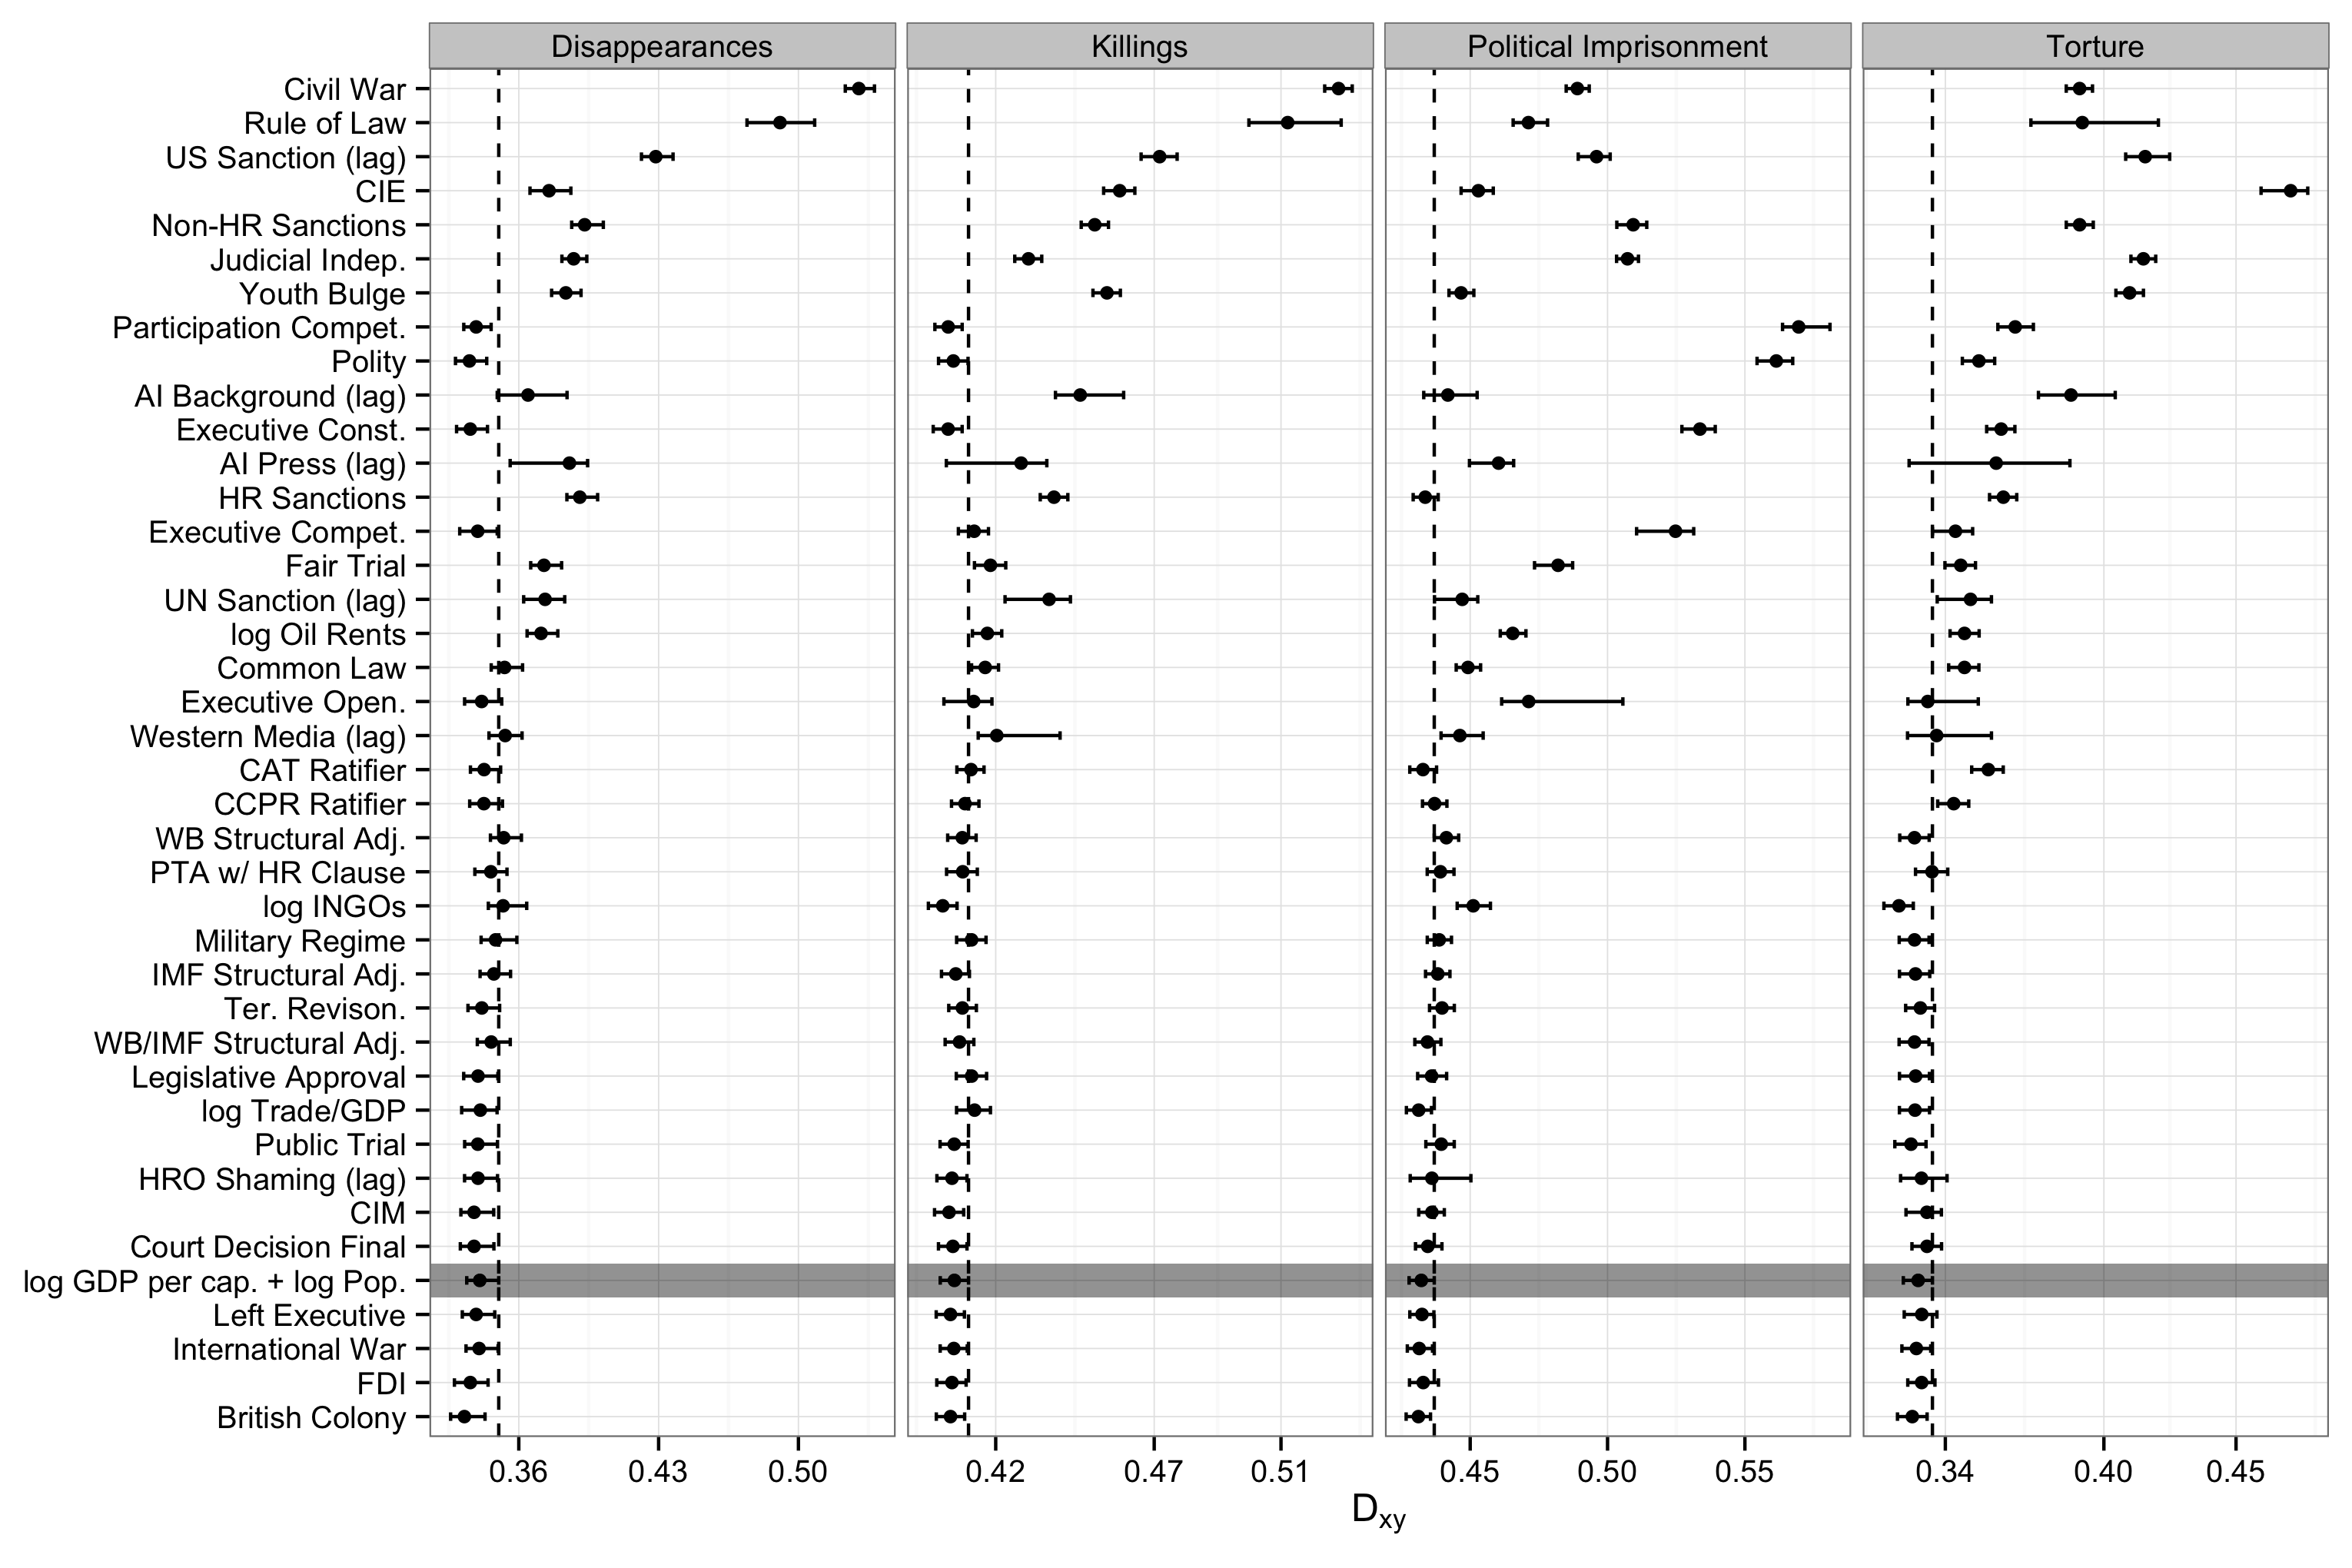
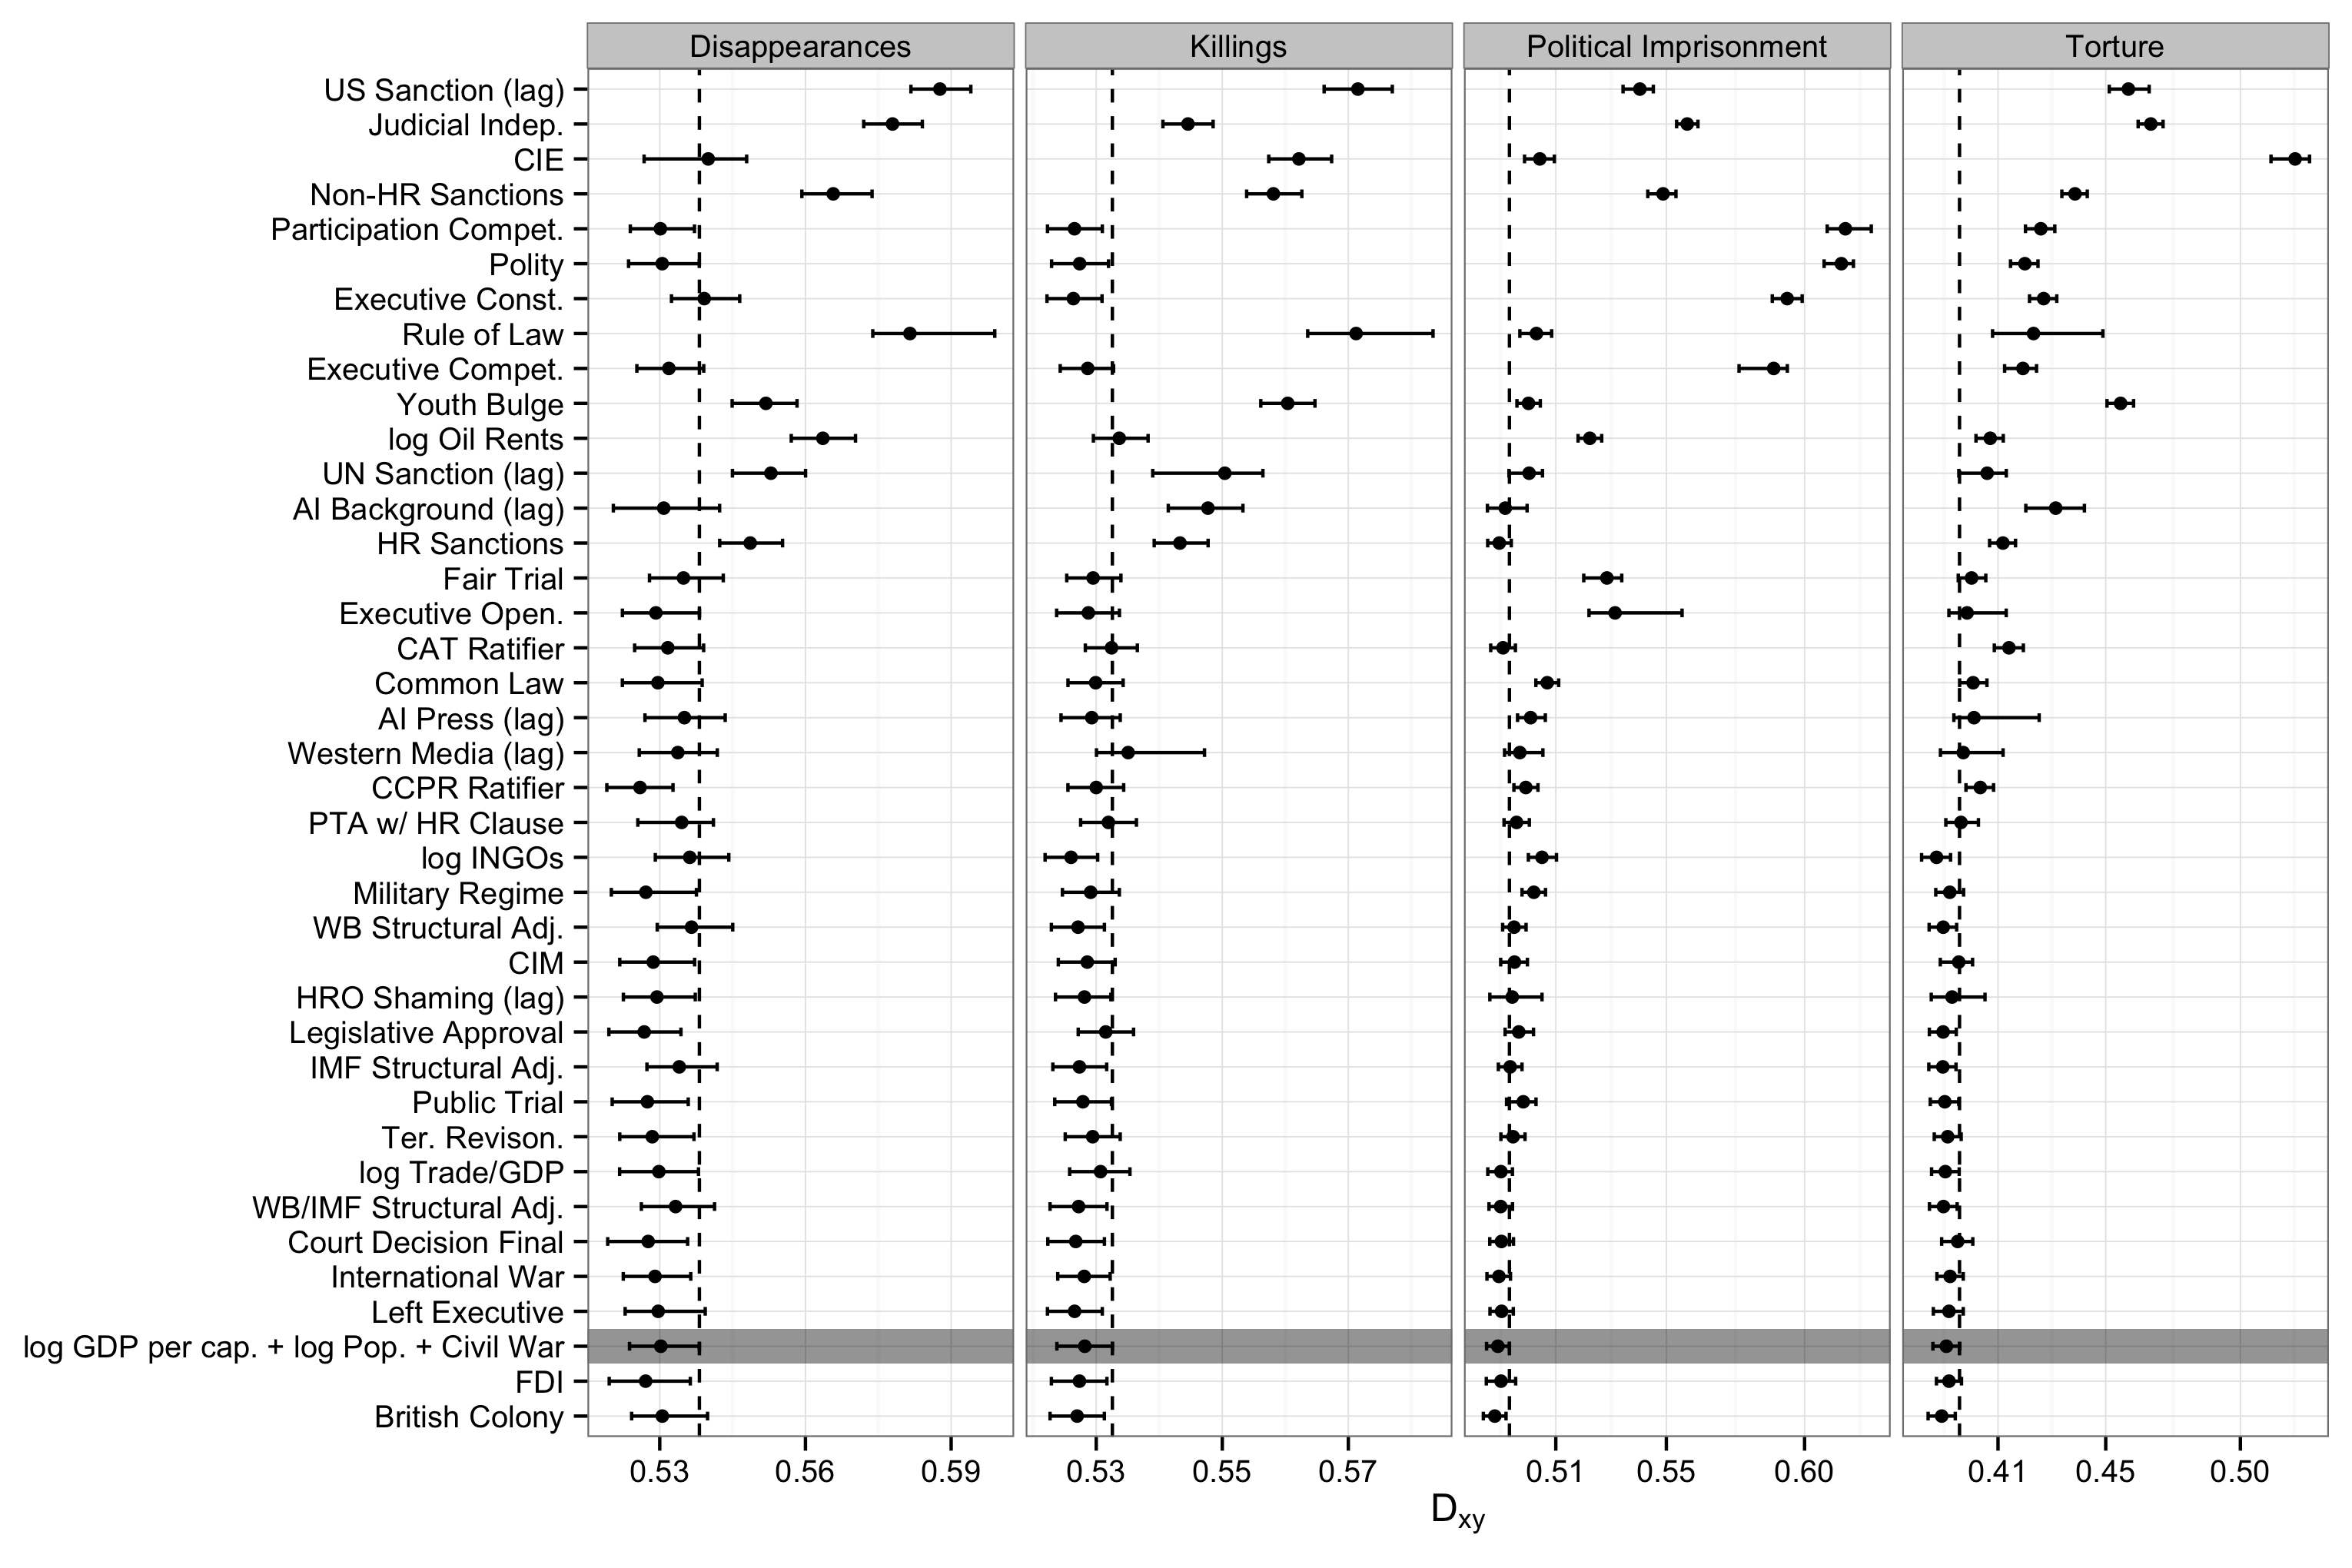
Results from 10-fold cross-validation with 1000 resampling iterations for ordinal logistic regression models of state repression using (the natural logs of) GDP per capita and population (top figure) and (the natural of logs of) GDP per capita, population, and civil war (bottom figure). The $x$-axis shows Somer's $D_{xy}$, a rank correlation coefficient that ranges from -1 to 1. The $y$-axis represents model specifications which are composed of a base model, which is indicated by the gray band, and the variable indicated on the $y$-axis. The dots show the median of the sampling distribution of the Somer's $D_{xy}$ statistic, along with the $.025$ and $.975$ quantiles. The dotted line shows the $.975$ quantile of the sampling distribution of the $D_{xy}$ statistic for the base model. Model specifications whose intervals overlap with this line do not add significantly to the fit of the model compared to the base specification.
Permutation Importance from Random Forests
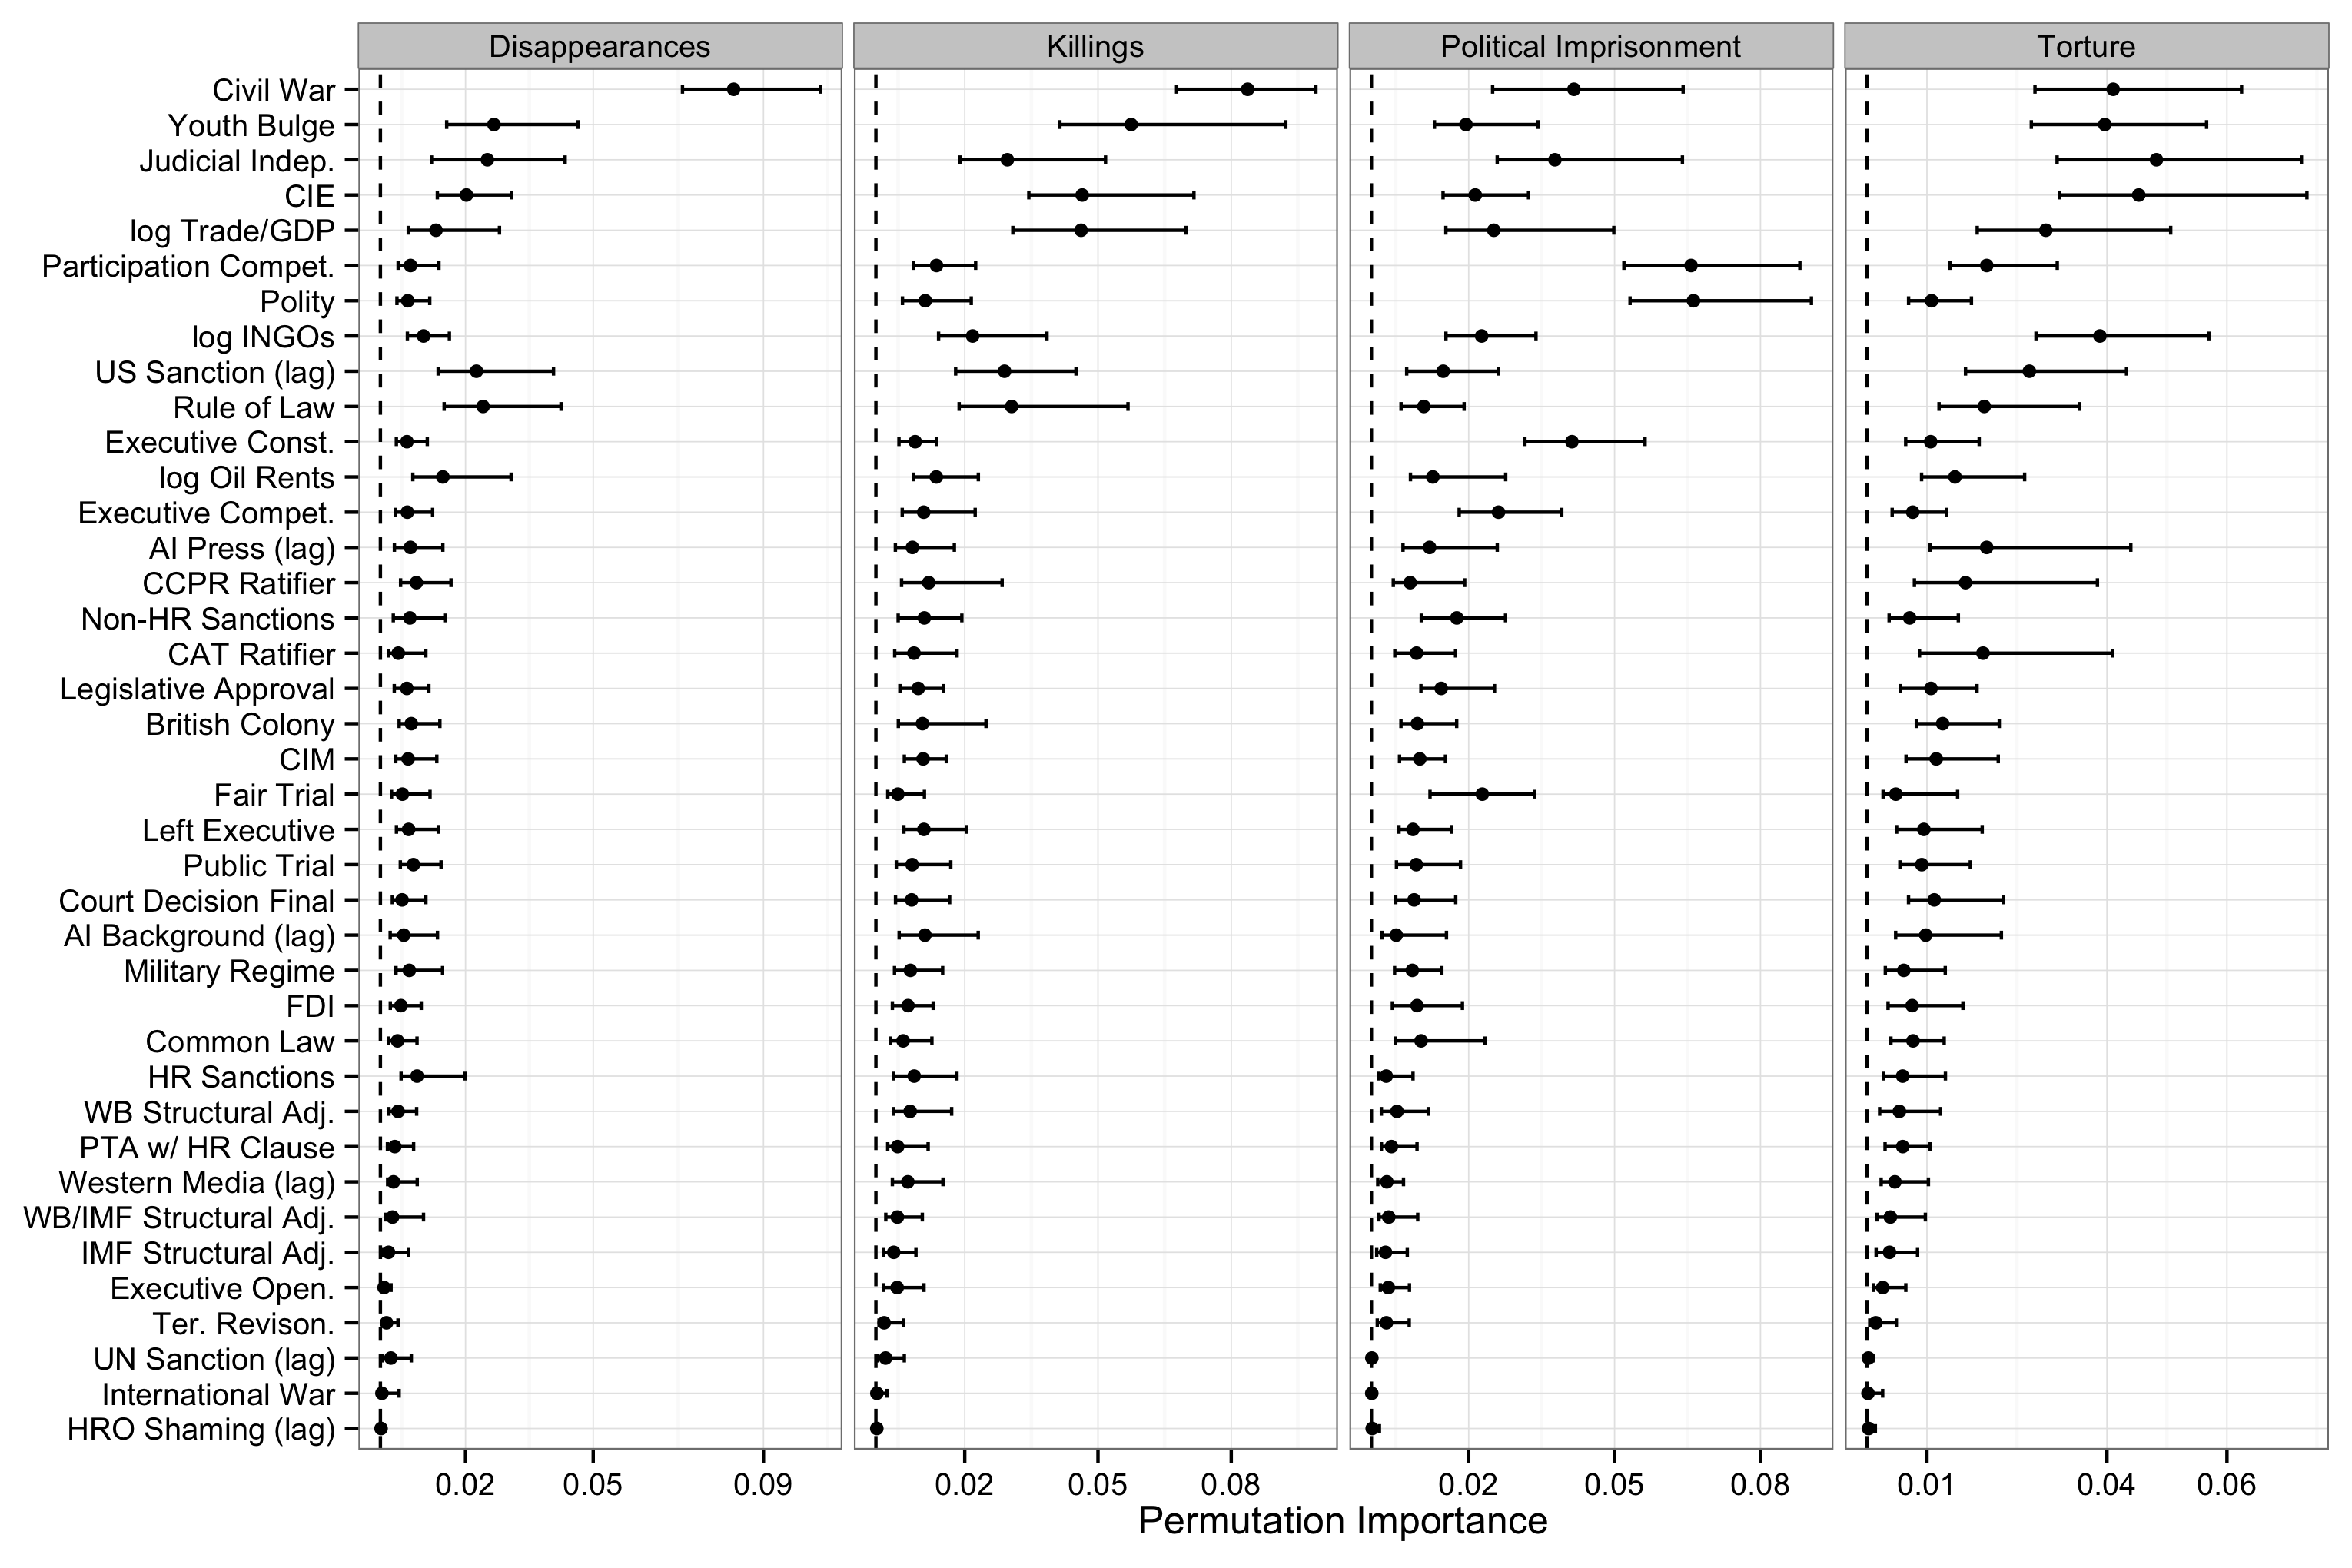
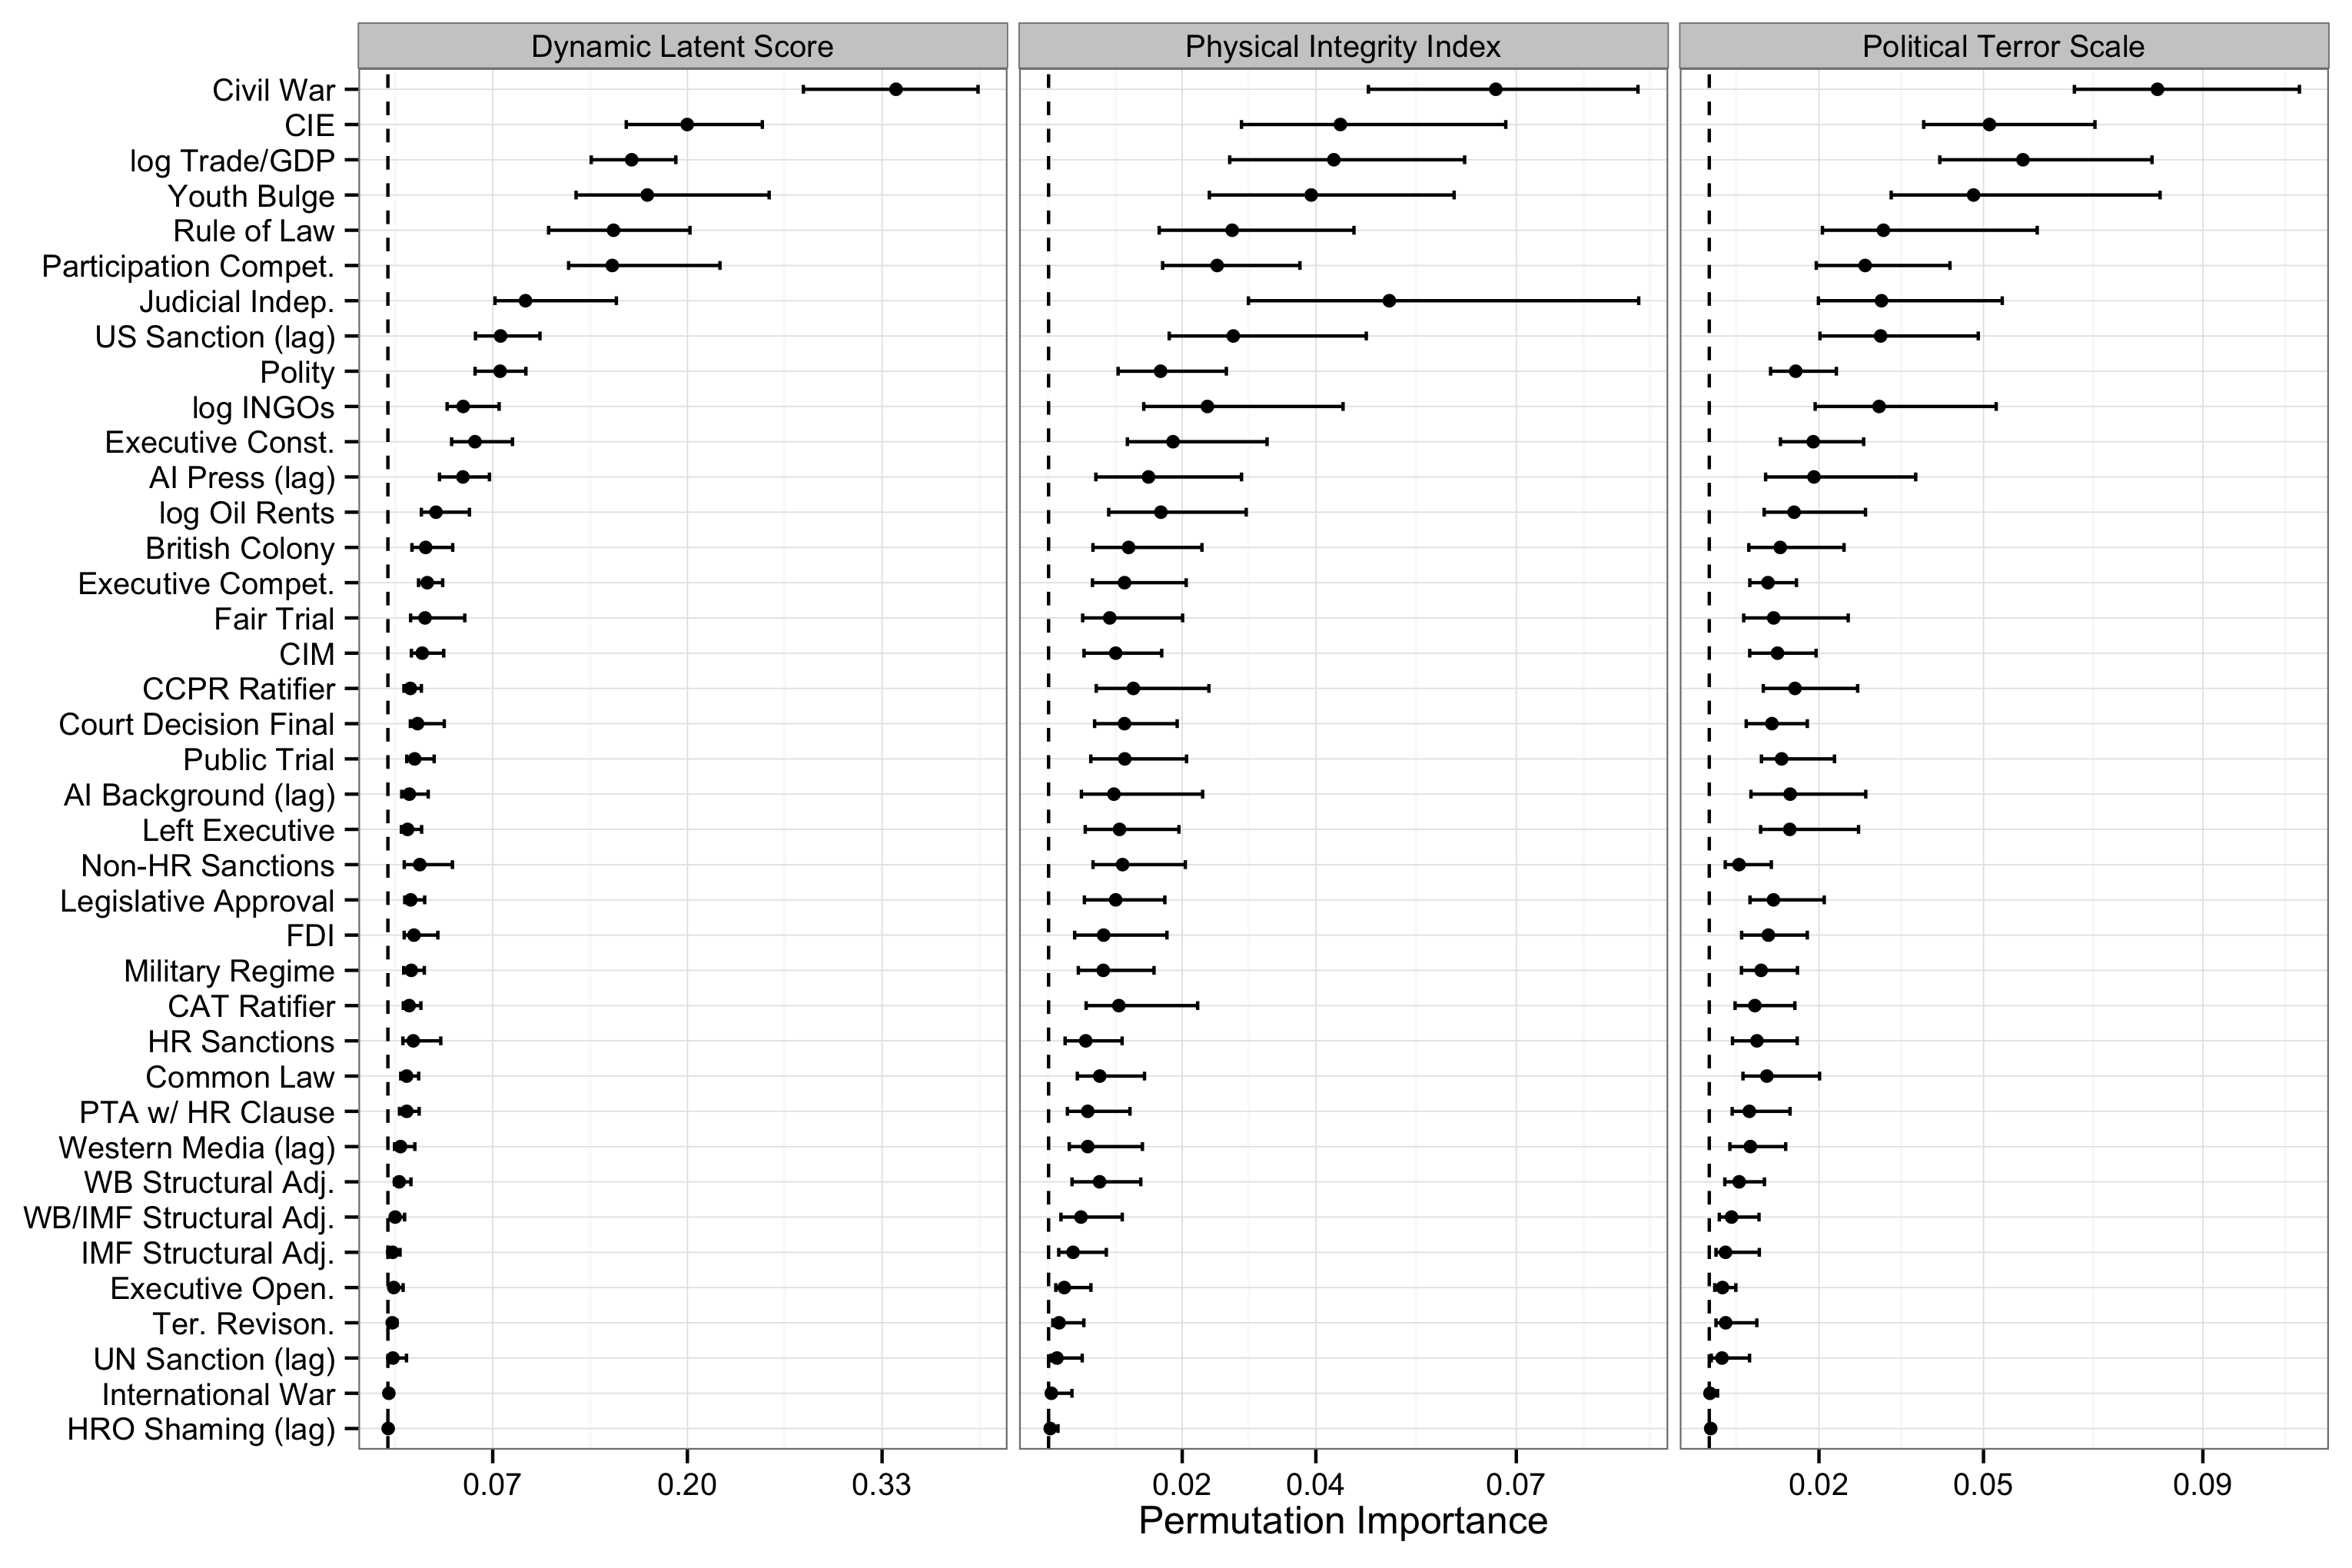
The marginal permutation importance of independent variables estimated using random forests, with the CIRI components as dependent variables (top figure), the latent measure from Fariss 2014, the aggregate CIRI scale, and the Political Terror Scale (bottom figure). Each panel pertains to a random forest model of the dependent variable indicated by the gray bar located at the top of the panel. Each dot represents the median of the bootstrapped sampling distribution of the mean decrease in classification performance that results from randomly permuting the variable indicated in the $y$-axis across all decision trees in the random forest. If the variable is truly important, permuting its values should systematically \textit{decrease} performance, whereas a truly unimportant variable should produce no decrease, or a random decrease in classification performance. The error bars show a bootstrapped 95\% credible interval from 100 bootstrap iterations.
The variables measuring the imposition of economic sanctions also do well. The measure of US-imposed sanctions does the best of these, and for the cross-validation (CV) analysis is among the top 5 for the linear models using CIRI and PTS. Non-human rights sanctions also do well in the CV analysis, placing in the top 5 for the CIRI aggregate index once civil war is added to the model. For the CIRI components US sanctions is also best among the four measures, placing third for the first disappearance and killing models (excluding civil war) and second for torture, and placing first for disappearance and killing once civil war is added. For the imprisonment models non-human rights sanctions adds the most power of the sanctions variables. The measure of US sanctions also places quite high in the permutation test. It is interesting to note that the variables which are reported to have the largest substantive effects in the sanctions studies, UN sanctions and human rights sanctions, are not the ones that add the most predictive power in our analysis. The performance of sanctions generally is notable because they stand out as an international political factor that performs very well. Sanctions also involve an explicit policy choice and so are changed much more easily than many of the other things considered in the analysis.
The contract intensive economy measure also does quite well. In the CV analysis it is in the top 4 for all of the linear models, and adds the most power of any variable to these models once civil war is added. It is also the best predictor of torture, and also does well at predicting the killing component of the CIRI index. This variable also does very well in the permutation test for the aggregate measures, torture, and killing.
The measure of territorial revision during a MID does not add much predictive power in either the CV analysis or the permutation test. However, in theory territorial revision has a complex relationship with state repression, interacting with both democracy and conflict severity, and the latter is not included in our analysis.
Erratum
In the course of extending this paper I discovered a data manipulation error that resulted in 33 country-year observations being erroneously dropped. This document gives a more detailed analysis of what happened. We have fully replicated the results with the accidentally dropped observations and verified that nothing has substantially changed. The code and data linked to on my curriculum vitae now link to the fixed code/data. This code should allow you to replicate the results as published.